
Could Gold Prices Fall by 71%? What History Tells Us About the Current Market Trend
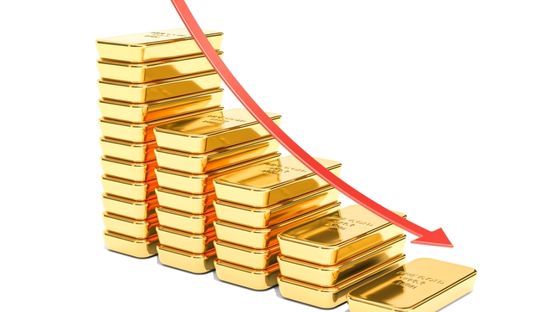
Gold and silver prices, which reached record highs earlier this year, have declined significantly in recent months. This has led many investors and buyers to wonder whether the prices will continue to fall or begin rising again, as seen in previous market cycles.
To better understand the current trend, it is useful to look at how gold and silver have behaved during major price corrections in the past.
In January 2026, the price of one sovereign (8 grams) of 22-carat gold touched around ₹1.33 lakh, while silver reached nearly ₹4.25 lakh per kilogram. Since then, prices have corrected considerably. Gold is currently trading at around ₹1.08 lakh per sovereign, while silver has declined to approximately ₹2.50 lakh per kilogram.
In the global market, gold has fallen by around 30% from its recent peak, while silver has corrected by nearly 54%.
Internationally, gold climbed to a high of $5,602 per ounce in January 2026 before declining to around $3,942 per ounce. During the same period, silver dropped from $121.6 per ounce to about $55.6 per ounce.
Although these declines appear substantial, historical market trends show that precious metals have experienced even deeper corrections in the past.
For instance, after rising nearly 773% in 1980, gold reached a then-record high of $873 per ounce before falling to $252 per ounce, a decline of nearly 71%. It took several years for prices to recover from that correction.
Similar corrections were witnessed after the major rallies in 1974 and 2011, when gold prices eventually declined by nearly 49% from their respective peaks.
Looking at these historical trends, the current correction of around 30% in gold is relatively smaller than some of the previous market declines. While history does not always repeat itself, it suggests that further corrections cannot be ruled out.
Silver has also experienced sharp declines during earlier market cycles. Historical data shows that silver prices dropped by nearly 93% after the 1980 rally and by around 77% following the 2011 peak. Compared with those periods, the current decline of around 54% is less severe.
Market observers note that sharp price rallies are often followed by periods of correction, making such movements a normal part of commodity market cycles. Gold and silver have once again followed a similar pattern after reaching record highs earlier this year.
Another important factor is time correction. Historical trends indicate that precious metals have taken anywhere from a few months to several years to establish a long-term price bottom after a major decline. In some e cases, it has taken decades for prices to return to their previous record highs.
Although gold and silver have already corrected sharply since their January 2026 peaks, it is still too early to predict when the current cycle will end or when prices might begin moving higher again.
Disclaimer: This article is intended for informational purposes only and is based on historical price trends and publicly available market data. Gold and silver prices are influenced by global economic conditions, inflation, interest rates, currency movements, and geopolitical developments. This content should not be considered investment advice or a recommendation to buy or sell precious metals. Readers are advised to consult a qualified financial advisor before making any investment decisions.
Top Stories
-
Could Gold Prices Fall by 71%? What History Tells Us About the Current Market Trend07/Jul/2026 10:27:59 AM
-
 Pirandai: 10 Potential Health Benefits of This Traditional Medicinal Herb07/Jul/2026 10:09:46 AM
 -

-
 WhatsApp Tests New Green Dot Indicator to Show Online Contacts07/Jul/2026 10:02:56 AM
 -
 Crack Detected on Railway Track Disrupts Chennai Beach - Tambaram Train Services07/Jul/2026 9:52:40 AM
 -
 Gold Prices Continue to Decline in Chennai; 22K Gold Falls ₹160 per Gram07/Jul/2026 9:51:07 AM